Graffitis
posted: September 06, 2010 at 06:44 PM categories: css3, canvas, yui, animation, html5, interactive view comments
Download Video: WebM | MP4 | OGG
Running the demo
Click the 'start svg demo' on the page. When the page is loaded, it has the following header:

You can do several things (which are explained later on):
- select one of the predefined graffitis following the 'On blackbook' label and see them rendered with SVG and Canvas. There are two predefined graffitis: one is 'draw' from an unknown contributor and the other one is 'katsu' from Katsu.
- select the random link and see an random graffiti from the http://000000book.com/ (black book) graffiti repository.
- select the 'record' button and click and drag in the black drawing area to draw strokes. To start a new stroke, release the mouse and the click and drag to draw the new stroke. When you are done recording the graffiti, you can select the 'play' button to see it rendered with SVG and Canvas
- export the graffiti as SVG when clicking on the 'show SVG' button.
- see the graffiti's GML source when clicking on the 'show GML' button.
- show an alternate rendering of the graffiti using the 'overlay' filter by clicking on the 'show brick overlay' button.
The 'spray paint' check box turns the Canavs rendering on or off.
Graffitis and the Graffiti Markup Language (GML)
Graffitis go from the simplest scribbles to the most sophisticated artwork, as you can see on Flickr for example.
There is amazing work done to capture graffiti drawing and render them with computers graphics. Some renderings are absolutely stunning, as the work done by Chris Sugrue and Evan Roth shows.
The graffiti data is captured in the Graffiti Markup Language, GML. http://000000book.com/ (black book) is a repository of GML graffitis. Graffitis can be created with applications such as FatTagKatsu for the iPhone to draw tags and upload them to the Blackbook repository.
Using SVG and Canvas together
This demo uses and manipulates GML JSON data to render and animate
tags in the blackbook tags repository.
The graffiti data is turned into a number of SVG <path>
objects and the 'drawing' effect is simply done by animating the
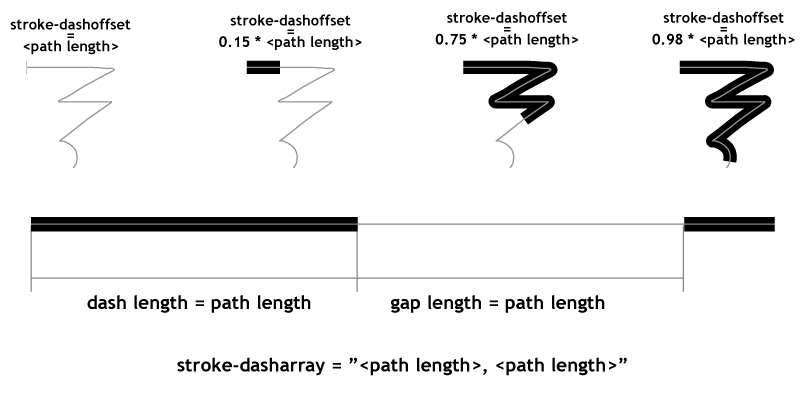
stroke-dashoffset on the different path elements.
The getTotalLength method on the
SVGPathElement interface provides the length for each
path and lets the code compute the proper stroke-dashoffset
value. This is illustrated in the following figure.

The rendering also uses the Canvas API
to draw particles of paint as the stroke gets rendered. The particles are sprayed based on the
speed of the pen as it moves along the graffiti. The canvas with the particles is
part of the SVG tree, as a child of a foreignObject element,
which demonstrates how well the two rendering models can be combined.
The demonstration also shows how to simply create a GML file: when the user selects the 'record' button, he/she can the draw on the canvas and then select the 'play' button when done. This will render the rendering of the captured GML content.
An 'overlay' filter effect lurking in a corner
Finally, the demonstration illustrates an overlay filter effect.
The overlay compositing rule does not come directly in SVG as
it is not part of the
<feBlend>
modes. However, it is possible
(even though a bit computation intensive) to create an overlay by
combining the 'multiply' and 'screen' modes of <feBlend>.
This is a bit of a sophisticated filter which I'll further describe
in a separate demo decicated to just that filter.
An ugly hack also lurking
Several implementations (Firefox 3.6, Safari 5.0 and Chrome 6.0) have a
bug at the time of this writing and fail to correctly render stroke line
joins when the path points are closer than the stroke width. The code
contains an ugly hack to get the
visually correct result. The hack consists in adding
circles at the point poisitions to make sure the line joins are properly
rounded. This is ugly because it adds to the DOM load (many
<circle> elements are added) and slows down the
animation.
The page header uses the HVD-Peace font.